The Ultimate Guide To Surveys
Are you someone who values customer feedback as an irreplaceable asset?
Would you like to know how to create surveys that gather detailed feedback and get a deep understanding of your customers?
If yes, you're in the right place.
This guide will help you learn how to create and send surveys that provide accurate and honest feedback to your company.
It will take you through the following sections:
- Different types of surveys
- When and how to use surveys
- Questions to ask when designing a survey
- Softwares that can help design and send a survey
- Understanding survey methods and how to analyze the data
- Knowing what might bias your results
- What can survey logic and branching do for you
Types Of Surveys and Their Use Cases
In this section, you will learn about the different types of surveys.
With this knowledge, you can deploy a suitable survey per your needs.
1. Feedback or Customer Experience Surveys

"Your most unhappy customers are your greatest source of learning." - Bill Gates.
It feels good to think about all the people your business has satisfied. However, to get a complete picture of your customer base, you should also analyze the unhappy customers.
The three feedback surveys mentioned below will empower you with tools that offer quantifiable results to take your business to the next level.
NPS Surveys
Suppose you want to know how likely your customer is to recommend your brand. In that case, the Net Promoter Score survey is ideal.
The calculation is based on the percentage of 'promoters' minus 'detractors.'
A net promoter system that produces a positive score is good. However, a net promoter score above 50 is even better, and over 70 is excellent.
CSAT Survey
You can use CSAT surveys as online forms to gauge the overall satisfaction of the customers.
It will be helpful to note that even though customers might not enjoy an experience with your product or service, they can still be loyal (see NPS) to your brand.
CES Surveys
If you want to know how much effort the customer put in to complete a specific action, you need the customer effort score.
Unlike the CSAT and NPS surveys before, CES surveys can help highlight a particular process from the entire experience.
In this section, we have looked at three feedback surveys. The key takeaways are as follows:
- NPS surveys help understand whether customers will recommend the brand or not.
- CSAT surveys highlight the overall satisfaction of customers.
- CES surveys tell you about customers' efforts during a process.
2. Post-Purchase Surveys
Post-purchase surveys are a great way to capture customer feedback in an online store.
They are especially useful for measuring customer experience during the checkout process, user experience in your online shop, and easiness of doing business. For example, the before mentioned CES is a great feedback method for post-purchase surveys.
Keep in mind that you can't ask for feedback about the product or service yet at this point. If you want to collect insights about that, you will have to send another survey after a few days or weeks.
3. Product Surveys
Product surveys focus on the product or service. Its purpose is to map what customers think about the product in question and to help you improve it.
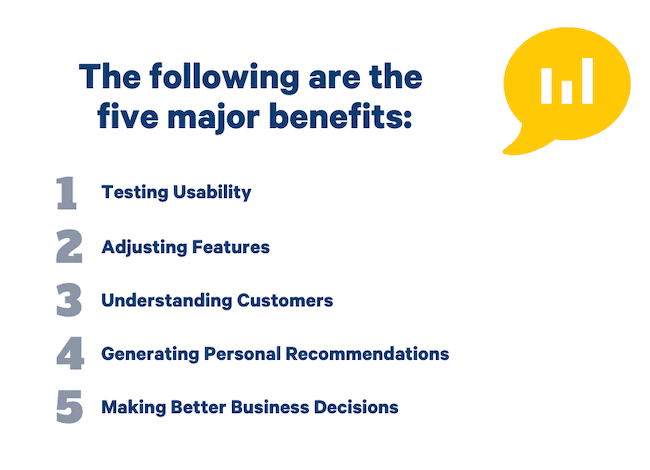
Five major benefits of using product surveys include:
- Testing usability
- Adjusting features
- Understanding customers
- Generating personal recommendations
- Making better business decisions
4. Market Research Surveys
"If you keep doing what you've always done, you'll keep getting what you've always got" – Jim Rohn.
Kodak was once a market leader in photography. However, they didn't evolve when digital photography hit the scene.
They had the wrong idea about being in the 'film industry' rather than the 'storytelling' industry. Kodak valued selling more products and not catering to the changing customer needs.
Marketing is not about promoting and selling the most product. It's about providing a company's customer base value and satisfaction.
Their closest competitor, Fujifilm, understood this. They conducted market research that best suited their goals while helping them understand their customers' needs.
Be like Fujifilm. Use surveys to:
- Identify your ideal customer profile(s)
- Map out the awareness stage of your target audience
- See how you compare against your competitors
5. Employee Satisfaction Surveys
Satisfied employees and a healthy work environment should be the standard in any business. It's not just the employees that benefit from it – the whole organization is more productive when these things are in order. This will also be reflected in customer satisfaction.
Conducting regular employee satisfaction surveys. helps you keep in touch with your employees and improve the organization.
Whether you use short and regular employee pulse surveys or longer and more thorough employee engagement surveys, make sure to really take the insights to heart.
Survey Design: Key to Success
When conducting surveys, there are many thresholds you have to overcome.
- How to reach your audience/sample group?
- How to make people open your survey in the first place?
- How to motivate them to respond?
- How to make sure they complete the survey?
- How to get the answers you need?
- How to avoid bias in the data?
- How to make the correct conclusions from the results?
All of this can be aided by effective survey design.
Introduction
It all starts with a compelling survey introduction.
If you send surveys via email, the survey title and subject line become before the introduction.
Here you'll need to convince the respondent to complete the survey.
Some key arguments include:
- Your opinion matters to us.
- Your opinion will help us improve.
- Your opinion will help others to make decisions (especially when asking for public feedback like reviews).
- It will only take a moment.
Sometimes, you might even want to offer incentives to respondents. They can be small things like a discount coupon or an Amazon gift card.
Accessibility
Making surveys as easy as possible to use is key to maximizing the response rate.
Understandably, some users might not be as competent with digital devices and online surveys. In these instances, consider other types of collection methods, such as phone calls.
Further things that aid accessibility is formulating clear survey questions that can be easily understood by anyone. It's impossible to completely avoid misunderstandings, but clear questions are integral for avoiding survey bias, that we will discuss later in the article.
For example leading questions can severely distort the survey data.
Appearance
The survey's appearance makes a difference in giving a professional image.
Using brand colors and a modern, sleek design will help you build credibility.
Next, let's dive into survey questions, sending methods, and analyzing the results.
Which Questions to Ask On a Survey?
This section will cover everything you need to know about formulating the right questions. I will go through some general guidelines and cover various types of survey questions.
Keep the following types in mind to create surveys that get you a high response rate:
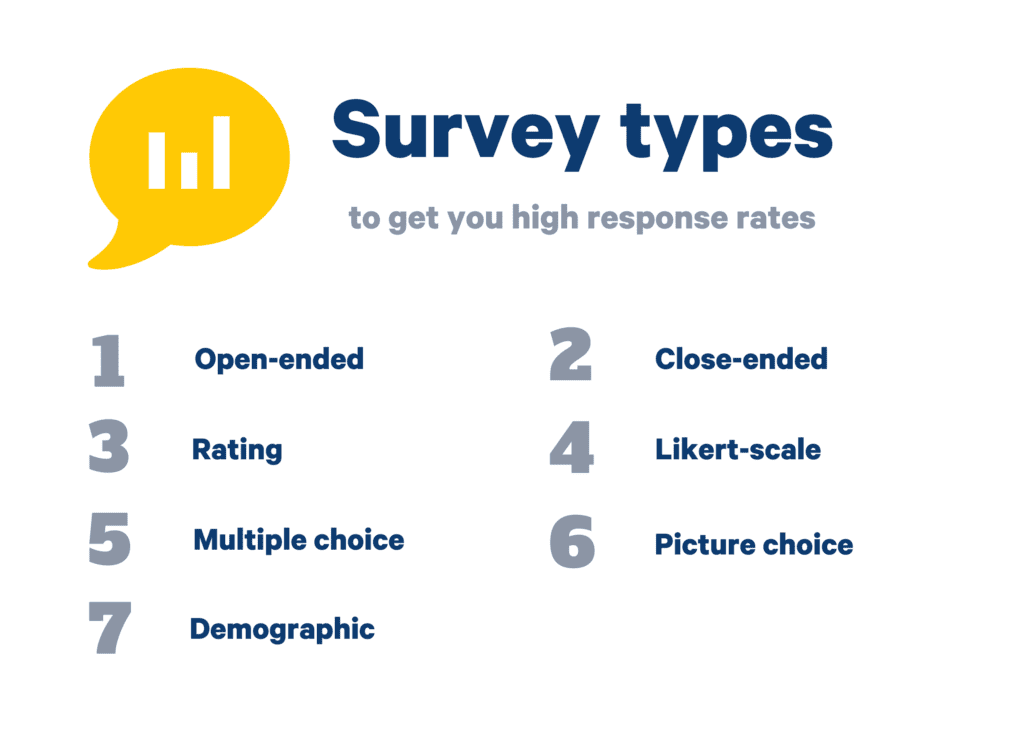
- Open-Ended
- Close Ended
- Rating
- Likert Scale
- Multiple Choice
- Picture Choice
- Demographic
Let's begin.
As a general guideline, your survey questions should:
- Be clear and direct
- Achieve your survey goals
- Consider the user experience
- Not be biased
The following are some types of questions you can ask the customers, along with examples that you can use to create your online surveys.
Open-Ended
Open-ended questions allow the customers to explain themselves thoroughly.
They can highlight blind spots that you may not be aware of. Answering and analyzing the open-ended questions' data can be a tiresome task. Hence, you might find customers hesitant to answer these questions. Yet, the value they provide cannot be overstated.
- How are you feeling?
- What was the best feature of the product?
Close Ended
Yes, or no, simple yet effective.
Close-ended questions are the opposite of open-ended questions. They are relatively easier to answer. Furthermore, it is easy for you to analyze their data too. However, they only reveal information that you already know.
- Did you order the lamb?
- Do you speak another language?
Open-ended vs Close Ended Questions

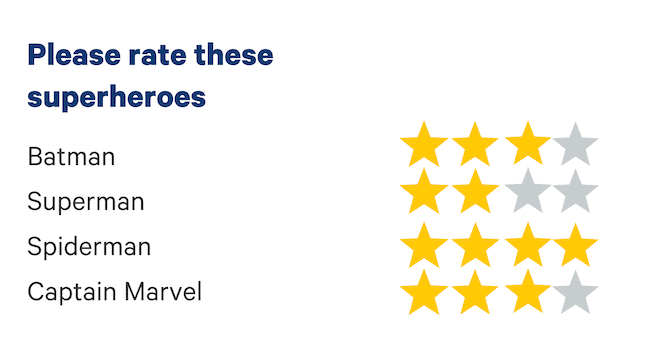
Rating
Ask your customers for a number.
Rating questions are efficient at finding out how well a product is performing, how consumers feel about it, and a quick comparison between various products. They are easy to answer as they only require a tap or click.
However, the results can be skewed by customers who exaggerate their answers.
- What rating would you give this app?
- Out of 5, how many stars will you give us?
Likert Scale
They offer great insight and are generally presented in 5, 7, or 9 points scales.
Likert scales expand on the simple yes or no questions. They are widely used in customer satisfaction surveys because they are quick to answer. Analyzing the answers to Likert scale questions allows you to dig deeper and find out more about a specific topic.
- How affected are you with changes in the office?
- Do you agree that x is better than y?
Multiple Choice
Make it easier for the customers by narrowing their choice of answers.
MCQs offer an easy survey-taking experience. They offer you clean and easy-to-analyze data sets. Furthermore, you can customize these questions to fit your specific needs. When designing MCQs, you must be careful about introducing biases in your answers. Customers might answer randomly if they see that their answer is not present in the options.
- How many hotels have you been to?
- What is the capital of the USA?
Picture Choice
One of the best ways to increase customer engagement.
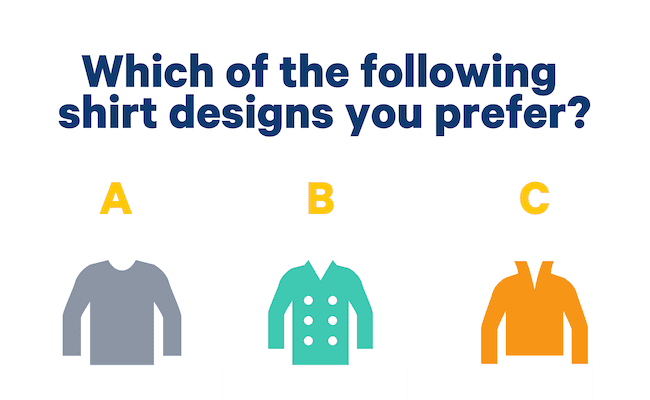
Picture questions show the participants different images. They ask the customers to pick one. You can imagine picture questions being similar to MCQs with images. They can serve as a welcome break from reading text. Just ensure that the pictures you use are of high quality.
What about you give respondees the option to respond to surveys using images?
Demographic
A little personal, but perfect for segmentation.
Demographic questions are an efficient way to gather insight into your target audience. Furthermore, you can segment customers based on different factors by analyzing the results. It's helpful to note that not all customers might be willing to divulge personal information.
- Where do you live?
- What is your gender?
The key takeaways from this chapter include general guidelines for formulating effective survey questions and different types of questions that you can use in your questionnaires. Be sure to keep these questions in mind when creating your survey.
Customer Journey - The When
I classify the customer journey in three stages; awareness, consideration, and decision. The following table shows five questions you can ask the customers at each stage.
| Awareness | Consideration | Decision |
| The biggest problem you face with (product/service)? | What are your biggest worries about the problem? | Do any other companies come to mind when thinking about the product? |
| What bothers you most about (buying a product, completing a task)? | What's the simplest way to solve the issue? | Who would you purchase from if the brands had different prices for fixing the problem? |
| What is your go-to solution for fixing this problem? | If you were to try (your brand), what would make you choose that option? | What is your go-to brand for fixing this problem? |
| What other ways have you thought about fixing the problem? | What are your thoughts on (your products)? | Have you tried another brand to solve this problem? |
| Have you thought about (your brand) for fixing this problem? | What rating will you give us based on these factors of buying from (your company)? | Do these features (advertisements) make you want to buy from us? |
Survey Logic And Branching
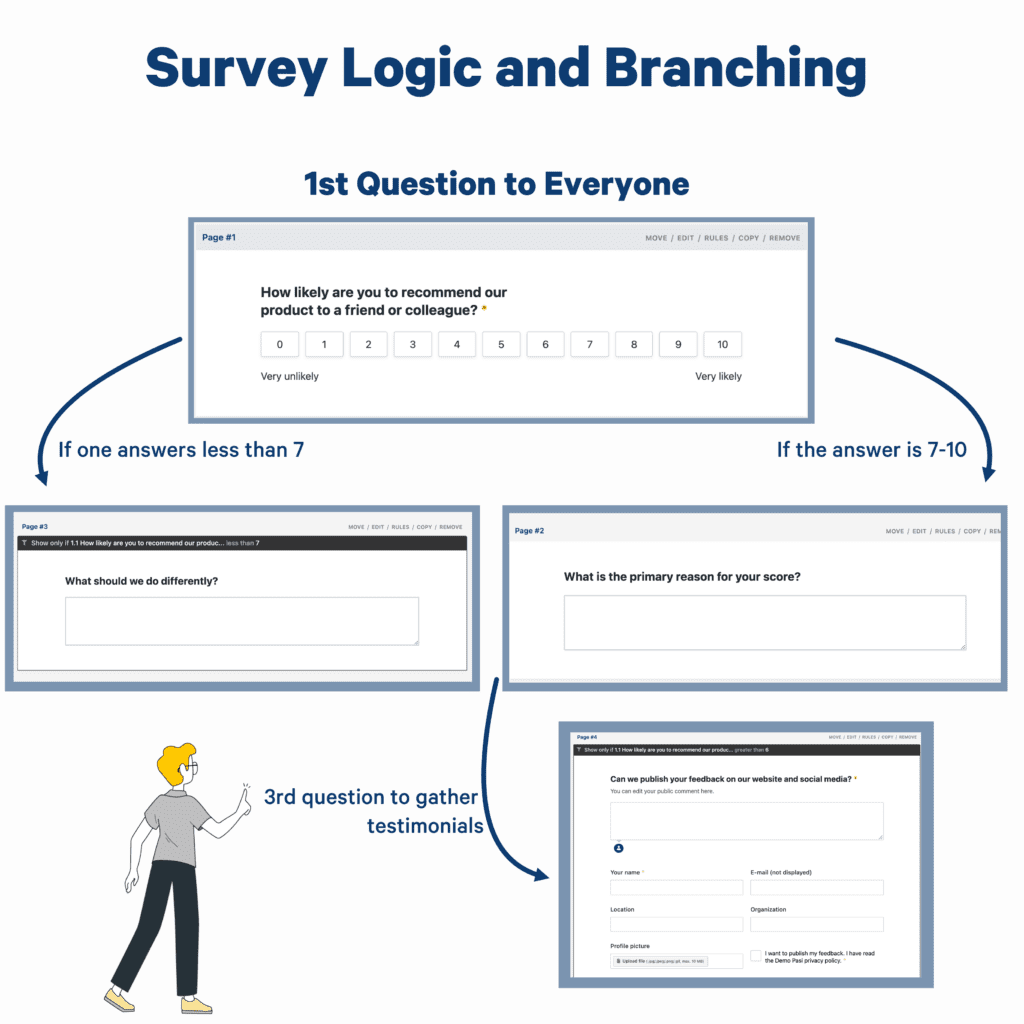
Imagine designing a survey that changes appearance, behavior, and content based on the customers' answers. That is what survey logic allows you to do.
By using features like text substitution, answer masking, question routing, and in-survey calculations, you can design various branches that help you tailor the experience of answering a survey.
Branching allows you to filter customers by the questions they answer. Thus, you can streamline the entire process for the customer and yourself.
Branching and skip logic, in particular, help you identify the most valuable customers.
For example, you can show one block of survey questions to people who own your product and an entirely different block to people who don't own your products.
Beware These Survey Biases
In order to get actually mindful results in your surveys, you need to bear in mind that there are factors that might affect them.
We brushed on some of the earlier, but here's a more comprehensive explanation.
Survey bias refers to different factors that distort survey results.
Sometimes it has to do with the survey itself: maybe it's confusing or maybe it leads respondents on in an undesirable way. Other times, it has to do with the respondent's personal circumstances: maybe they are not willing to answer, or maybe they don't complete it all the way through.
It's important to note that you cannot fully avoid survey biases. They are always present. However, you can interpret your results better when you are aware of them.
Here are a couple of biases you want to pay attention to:
1. Non-Response Bias
Non-response bias occurs when people don't answer your surveys.
It might be caused by one of the following reasons:
- No interest in your survey
- Your survey is too long and people don't complete it
- The survey is confusing, which prevents people from completing it
- Technical problems
- Forgetting to answer
- Don't want to answer, for one reason or another
The implications of non-response bias might be that your results do not accurately represent the sample group's actual opinions. It's problematic especially if the survey is intended for a set group.
Example: you want to find out what your family members think about the cake you baked for grandma's birthday. You send them a survey to rate the cake, and you get a shining review – but only a few answers.
You think you are the best baker ever, but the reality is that most family members skipped the survey because they didn't like the cake, but also didn't want to upset you.
(And then there is Aunt Margaret who didn't know how to open your survey link on the new fancy smartphone, and cousin Jack who was too busy with the punch and forgot about the whole thing).
Take time to analyze if there is a specific group of people who skip your survey.
Things you might try to fix non-response bias:
- Send reminders/ask again
- Offer incentives for respondents
- Make the survey more interesting
- Offer different ways of answering the survey (pen and paper for aunt Margaret)
- Check for any technical issues and confusing questions
2. Question Order Bias
Sometimes, the order in which your questions and answer options are presented can affect the answers, and lead to biased results.
For example, people are more likely to choose options that are higher on a list (especially if they are not very engaged to answering your survey and want to just get it over with).
Additionally, one question might guide the respondent's thoughts in a specific direction. If you first ask what the respondent's favorite holiday resort is, and next you ask where they would like to travel next, it might well be the same answer again.
In contrast, if you first ask where they would like to travel, and only after ask about their favorite resort, the answer might be less guided.
To avoid question order bias, you can try shuffling the questions and response options.
3. Sampling Bias
You might majorly bias your survey results if you don't pay attention to the quality of your sample group.
If you only choose people who represent one group or opinion, you will get answers accordingly. In this case, you can't confidently say that this is what all people think – it only represents the opinion of a specific group.
Things that affect sampling bias:
- Too small a sample group
- Demographically limited group
- Only asking from people that have already made their stance clear about your research topic.
It doesn't mean you should always try to include everyone in the sample group: not at all. It's important to choose the right representation for your surveys.
But keep that in mind when analyzing the results. If you conduct a customer voice survey about the quality of your company's customer service, but only send the survey to one customer service agent's clients, you won't learn what customer service looks like in your company. You will find out what people think about this particular person.
4. Acquiescence Bias or Extreme Response Bias
Acquiescence bias is a phenomenon when people agree with your survey excessively, without actually agreeing with you, or answering "yes" even when it contradicts the previous answers.
There can be different causes for it:
- The respondent doesn't actually think about the responses but wants to just quickly complete the survey, thus always choosing the same option.
- Respondent wants to save your face (some cultures are more adamant about it than others).
- There is no "in the middle" or neutral option to choose, so they choose the affirmative even though they don't have an opinion.
The same can go the other way: someone might answer with "no" or disagree. These biases can also be described as extreme response biases.
5. Neutral Bias
The opposite of acquiescence or extreme response bias is the neutral bias, in which people always choose the middle or neutral option. Something along the lines of "not agree or disagree", "I don't know", "I don't have an opinion".
It might happen for the same reasons as above, but also because they genuinely have no opinion about the issue.
You can easily avoid neutral bias by not including neutral answers, but then you will drive yourself in the direction of extreme response bias.
This further proves that you simply cannot completely avoid survey bias.
Channels – How to Distribute Surveys
Have you created a completed survey? That's great!
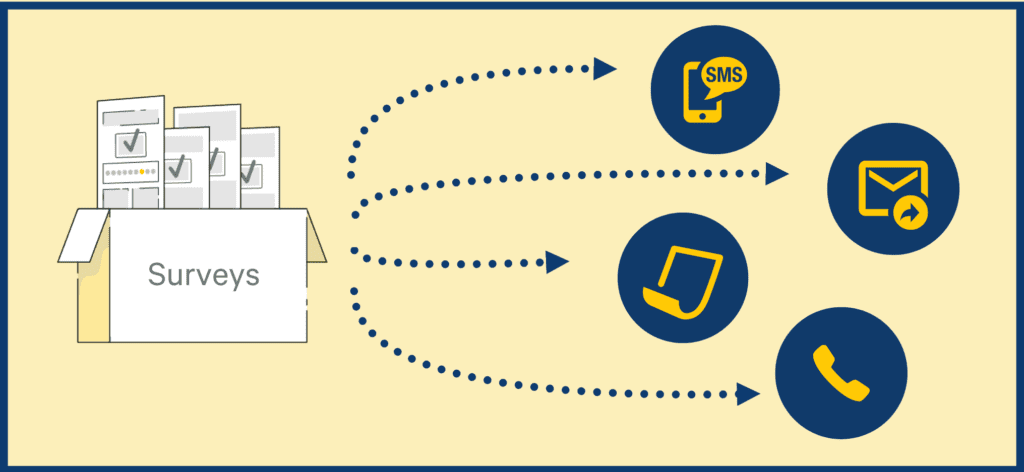
All that is left is knowing how to ask your customers these questions. That is where channels come in.
Sending surveys via the right channels helps you reach the target audience you need for your data collection.
Nowadays many companies only do online surveys, but they have their advantages and disadvantages.
Let's go over all the possible ways to survey your customers.
Email is the most popular way of distributing surveys.
Whether you embed surveys into emails, use them in your email signature, or simply provide a survey link in an email, your survey is accessible to your customers at the most convenient time.
Some email providers, such as Outlook, have integrated survey features, but you will almost always get better results with a dedicated survey tool. They provide better analytics features, customization, and integration options.
Furthermore, automation allows you to trigger emails at specific intervals too. This ensures you can send surveys at the right time while reducing manual work.
The downside of email surveys is the survey fatigue that many customers might experience with emails. Your surveys might get buried in the flow of emails.
That's when reminders and memorable subject lines become extremely important. Here are some tips for sending NPS email surveys to your customers to help you out.
SMS
SMS messages have a 98% open rate. Hence, it is one of the easiest and fastest ways to reach a broad audience and gather post-service data.
WhatsApp surveys are just as effective.
Phone Call
There is no replacing the human touch. A phone call allows you to interact on a deeper level with the clients and gather vital details.
While a smaller business can fo very well with just a mobile phone or a landline phone, larger international companies might benefit from a cloud phone system that enables multiple customer service agents to work on client calls.
Face To Face
Whether it is in the form of focus groups or one-on-one interviews, there is nothing quite like face-to-face questioning.
This method is mostly used for larger-scale market research surveys rather than simple customer satisfaction surveys. Understandably, organizing face-to-face interviews is high stakes for both the customer and the organization.
Social Media
Using social media to collect feedback is a good way to reach many customers in one go. Asking for a survey on social media also portrays your company as caring for the customers' concerns.
QR Code
If it is made easily accessible, QR code surveys can be a highly effective, low-investment way of getting customers to take a survey. They are the best form of survey distribution for offline businesses, like event business, restaurants, spas, and so on.
In-Store
In-store surveys can be done using tablets or hard copies. They help you gather real-time feedback directly on-site.
On Website
You can embed surveys on websites and even use popups or chatbots to target and personalize the survey better.
Some website builders, such as WordPress, allow you to implement different survey plugins that make collecting feedback easy.
When opting for this method, make sure you know what to measure in your survey, and whether the website survey reaches the target audience.
While surveys on websites are great for collecting immediate feedback about the website content and user experience, it's not as well suited for broader topics. Defining the target group is difficult, and responses are often anonymous.
On the bright side, response rates are high if you manage to keep the survey short and sweet.
Survey Data Analysis
So you narrowed down the questions you wanted to ask, perfected the design, and decided on the method for sending the survey.
Data has started coming in. It is time to analyze the gathered survey data.
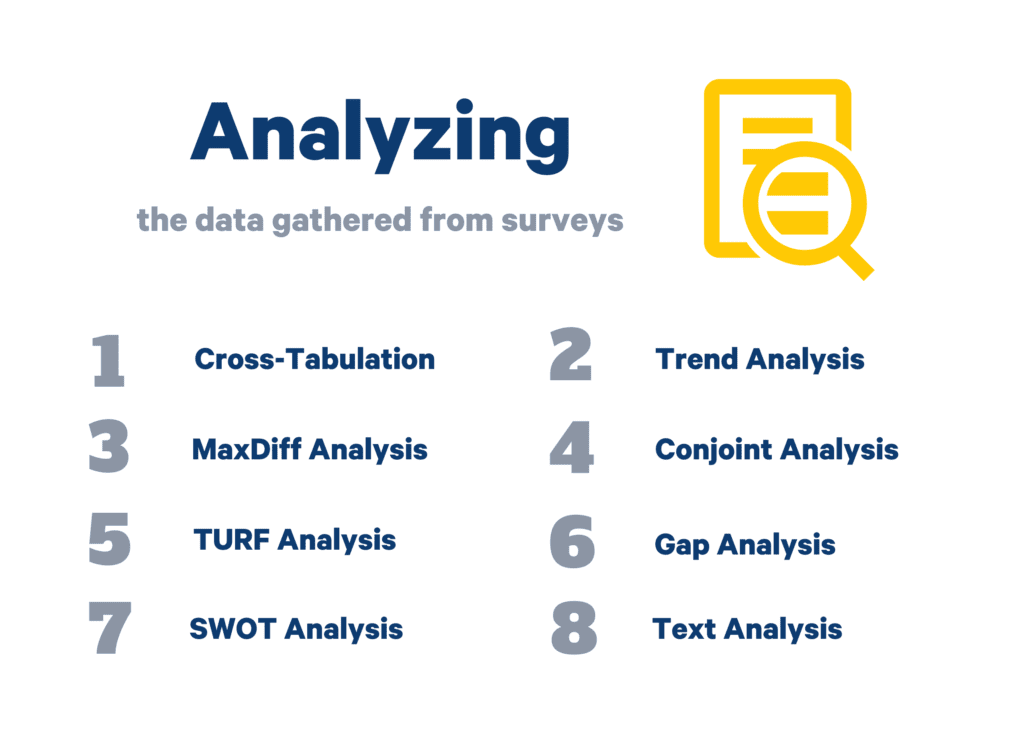
This section is all about finding the best way to analyze the data gathered from surveys. By the end of this chapter, you will learn various ways to analyze data best suited to your business. We will cover:
- Cross-Tabulation
- Trend Analysis
- MaxDiff Analysis
- Conjoint Analysis
- TURF Analysis
- Gap Analysis
- SWOT Analysis
- Text Analysis
Let's begin.
Cross-Tabulation
Cross tabulation is a quantitative method that analyzes the relationship between two or more variables. It is a great tool that helps manage large quantities of data while uncovering insights you might have missed.
Some questions you could explore with this method:
- Does the customer's demographic properties or awareness stage affect customer loyalty?
- How does customer satisfaction vary between customers who choose specific products or services?
- Is there any correlation or inverse correlation between different question responses, and what does that reveal about your business?
Trend Analysis
As the name suggests, trend analysis allows you to look at data over a long time. Thus, it helps observe any trends that might show up.
This analysis can be perfect for observing upcoming threats and opportunities.
After noticing a trend, it's important to discover what caused the trend in order to keep up or change the direction.
Gap Analysis
The 'Gap' in gap analysis refers to the distance between the actual and expected performance.
The gap analysis tells you about your level of business compared to industry standards at a strategic level. However, it can also give insight into the current state of performance compared to your business goals at an operational level.
One way where gap analysis comes in handy is benchmarking your NPS. By comparing your performance to the industry average NPS, you can learn where you stand in customer loyalty compared to your competitors.
SWOT Analysis
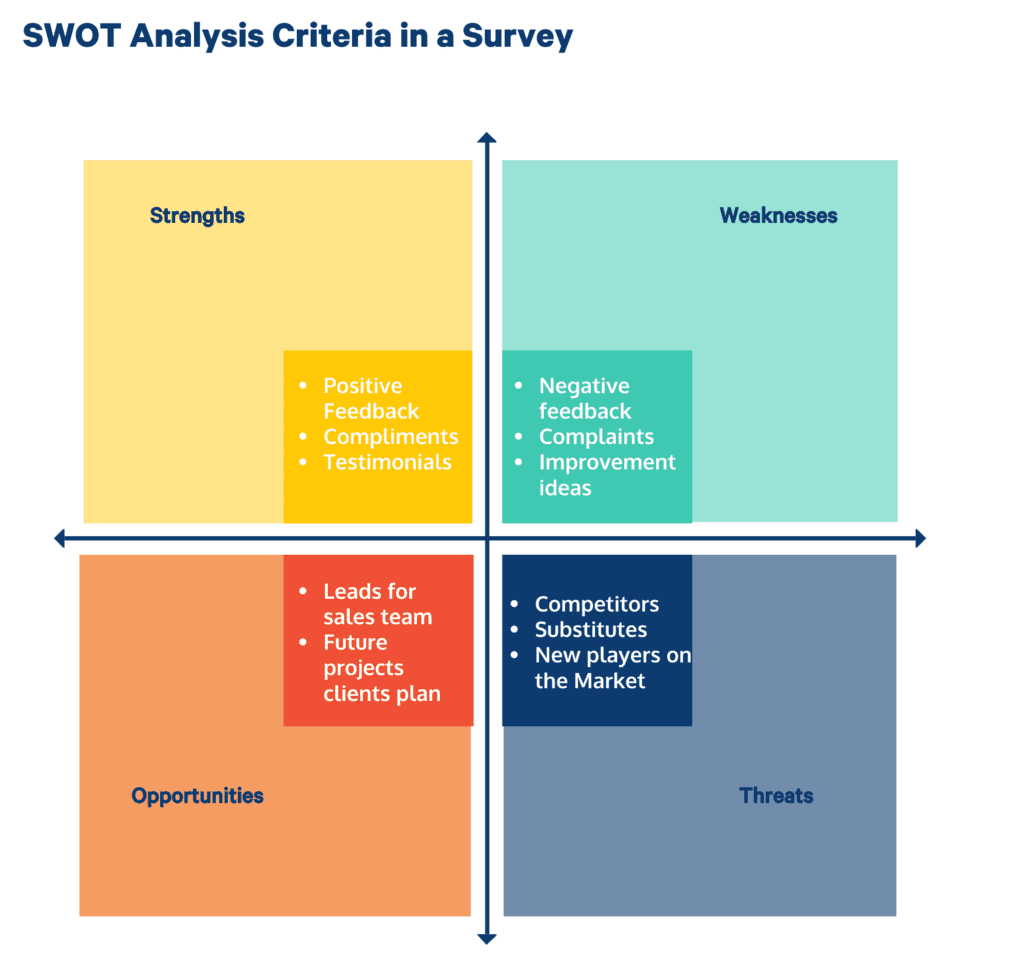
If you are looking for an analysis method that helps determine the company's competitive position, opt for SWOT analysis.
This method highlights fact-based strengths, weaknesses, opportunities, and threats of the organization.
The goal is to build on the strengths while nullifying the weaknesses. Furthermore, you should keep an eye out for opportunities while monitoring threats to your organization.
Text Analysis
Text analysis can help you bring order to a huge amount of data set. One of the most popular and visually appealing ways is using word clouds.
However, there are other ways, such as coding (converts words to numbers) and tags (filters specific terms).

Making Your Survey Report
Reporting your survey results in an understandable way is key.
Many survey tools include comprehensive survey reports, featuring visual charts that sum up results in an easy-to-analyze way.
On top of those charts and graphs, your survey report should include:
- What was the purpose of the survey: objectives, hypothesis, and background information.
- How it was conducted: who responded, what the questions were, and how the data was collected.
- Data analysis: summary of the data and highlights of important points. Considerations of the accuracy of the data.
- Findings: what kind of conclusions can be drawn from the data.
- Recommendations: actions that should be taken based on the results.
Best Survey Software Tools
This section will cover various software that function as customer survey tools. Some of these options allow you to approach customers through multiple channels and gather feedback. We will be looking at the following software:
- Trustmary
- Surveysparrow
- SurveyLegend
- Userflow
- Stamped
- Google Forms
- Salesforce Survey
Trustmary
Trustmary is a SaaS survey tool that allows customers to do surveys while simultaneously collecting and using testimonials.
The effective feedback and review collection flow is called the Trustmary Method. It produces higher response rates and gets you more reviews than the average customer feedback surveys.
Survey Types Available:
Question Types Available:
- NPS
- Text field
- Text area
- Checkbox
- Multiple selection
- Single select
- Multiple selection dropdown
- Selection dropdown
- Range
- Star rating
- Question group
- Add an image or video as a response to question
- Contact information
Along with ways to integrate social proof on your website, it also offers a drag and drop survey builder tool that allows you to build customizable feedback forms.
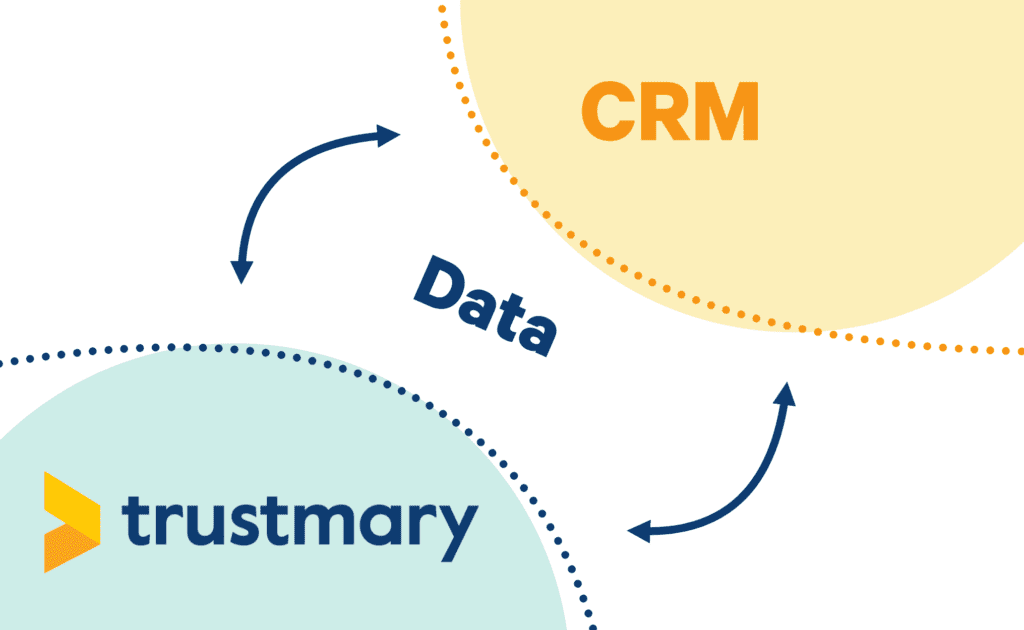
You can fully integrate Trustmary with your CRM to give the access to the customer satisfaction data to all relevant parties. No need to transfer data between systems, let the integrations do the work!
No matter what your industry is, you can create specialized surveys for real estate, hospitality or anything else.
Surveysparrow
Surveysparrow enables you to transform surveys into conversions. This software adds a conversational tone to the surveys making their forms highly engaging. The easy sharing options allow you to share your surveys over many platforms.
SurveyLegend
SurveyLegend is another cloud-based software that boasts a simple-to-use user interface.
It can help you customize the survey to match your branding and displays the data in eye-catching graphics.
Userflow
Userflow is an onboarding software that allows your entire team to build in-app surveys.
It's praised for being powerful and advanced to handle complex UIs while being user-friendly.
Stamped
Stamped is designed to help eCommerce companies to get reviews and build a customer loyalty program.
Additionally, users can also send out different types of surveys to customers via email, SMS or embed directly on website.
Google Forms
Google forms surveys are great and free.
However, they lack the easy distribution options.
Everything needs to be done manually, unlike with other options available.
Salesforce Surveys
For companies using Salesforce CMR, the Salesforce surveys extension might be worth looking into.
However, it get pricey very quickly.
To conclude:
- Trustmary allows you to create customizable feedback forms which also simultaneously collect testimonials. The testimonials can then be showcased easily on your company's website with innovative testimonial and review widgets.
- Surveysparrow helps you create engaging surveys and share them over many platforms
- SurveyLegend is easy-to-use and creates surveys that match your branding style.
- Userflow invites your entire team to customize the surveys. It is powerful enough to handle complex Uis.
- Stamped gives users access to reports which help in seeing trends and topics within the gathered customer feedback.
Best Way to Do Surveys
No matter if you opt for doing traditional surveys or online surveys, you should start doing them regularly. Preferably right away.
The benefits of doing so include:
- Improved customer experience as your customer feel valued when you ask for their honest feedback
- Increased customer loyalty, when you figure out what's wrong and fix the issues
- Surveys help you get actionable insights from your whole brand
This guide took you through the what, how, when, and more of surveys.
It covered the following topics:
- Different types of surveys and their specific uses
- Survey questions for particular points in the customer journey
- Channels used for distributing surveys
- The various types of questions to ask in surveys
- Online survey templates of major companies
- Various offline and online survey softwares
- Different survey methods and techniques to analyze survey data
- The benefits of using survey logic and branching
So what are you waiting for? You have all the tools available to create as many surveys as you want.
FAQ
How often should you survey your customers?
- It is a good practice to survey your customers through various touchpoints of their customer journey. Try this survey editor for each touchpoint of the customer journey.
- For recurring surveys, you shouldn't survey them before 90 days.
- However, you could survey them before that for more immediate insights regarding changes.
How many survey answers do you need to make generalizations from answers?
It depends on the sample size of the entire population and the margin error you are willing to accept.
Suppose you are surveying a population of 500 people and want to remain within a 10% margin error. In that case, you only need 80 people to answer the survey.
However, suppose you want to decrease the margin error to 5%. In that case, you need 220 people to answer the survey before you make generalizations.
How many questions should my survey have?
As a general rule, your survey shouldn't take more than 1 minute to complete. To hit that mark, you should aim for one to three questions.
However, if the questions are descriptive and open-ended, then reducing their number is beneficial.
